

Every trailer accounted for.

Every trailer earning.

Pinpoint trailers with excessive dwell. Perform a yard check without walking it. Catch unsafe trailers before the violation. Know the loaded status in your TMS.

hero-shap-5hero-shap-4
FleetPulse Trailer AI image
FleetPulse: Dwell time dashboard
FleetPulse: Yard check geofence

3 billion+

Trailer Miles

200+ fleets across North America

Averitt Express LogoBettaway Beverage LogoAAA Cooper LogoNFI Logo
Sandard Logistics LogoReyes Holdings LogoSibley Transportation LogoBen E Keith LogoAveritt Express Logo

Trailer AI

Turn your trailer data into insights, with plain English.

Trailer AI reads everything FleetPulse knows — position, dwell, sensor history, door events — and answers in plain language. Which yards are holding units over seven days? Which customers are sitting on our equipment? Which trailers threw an ABS fault twice this quarter? No report builder, no export, no ticket needed — just plain language.
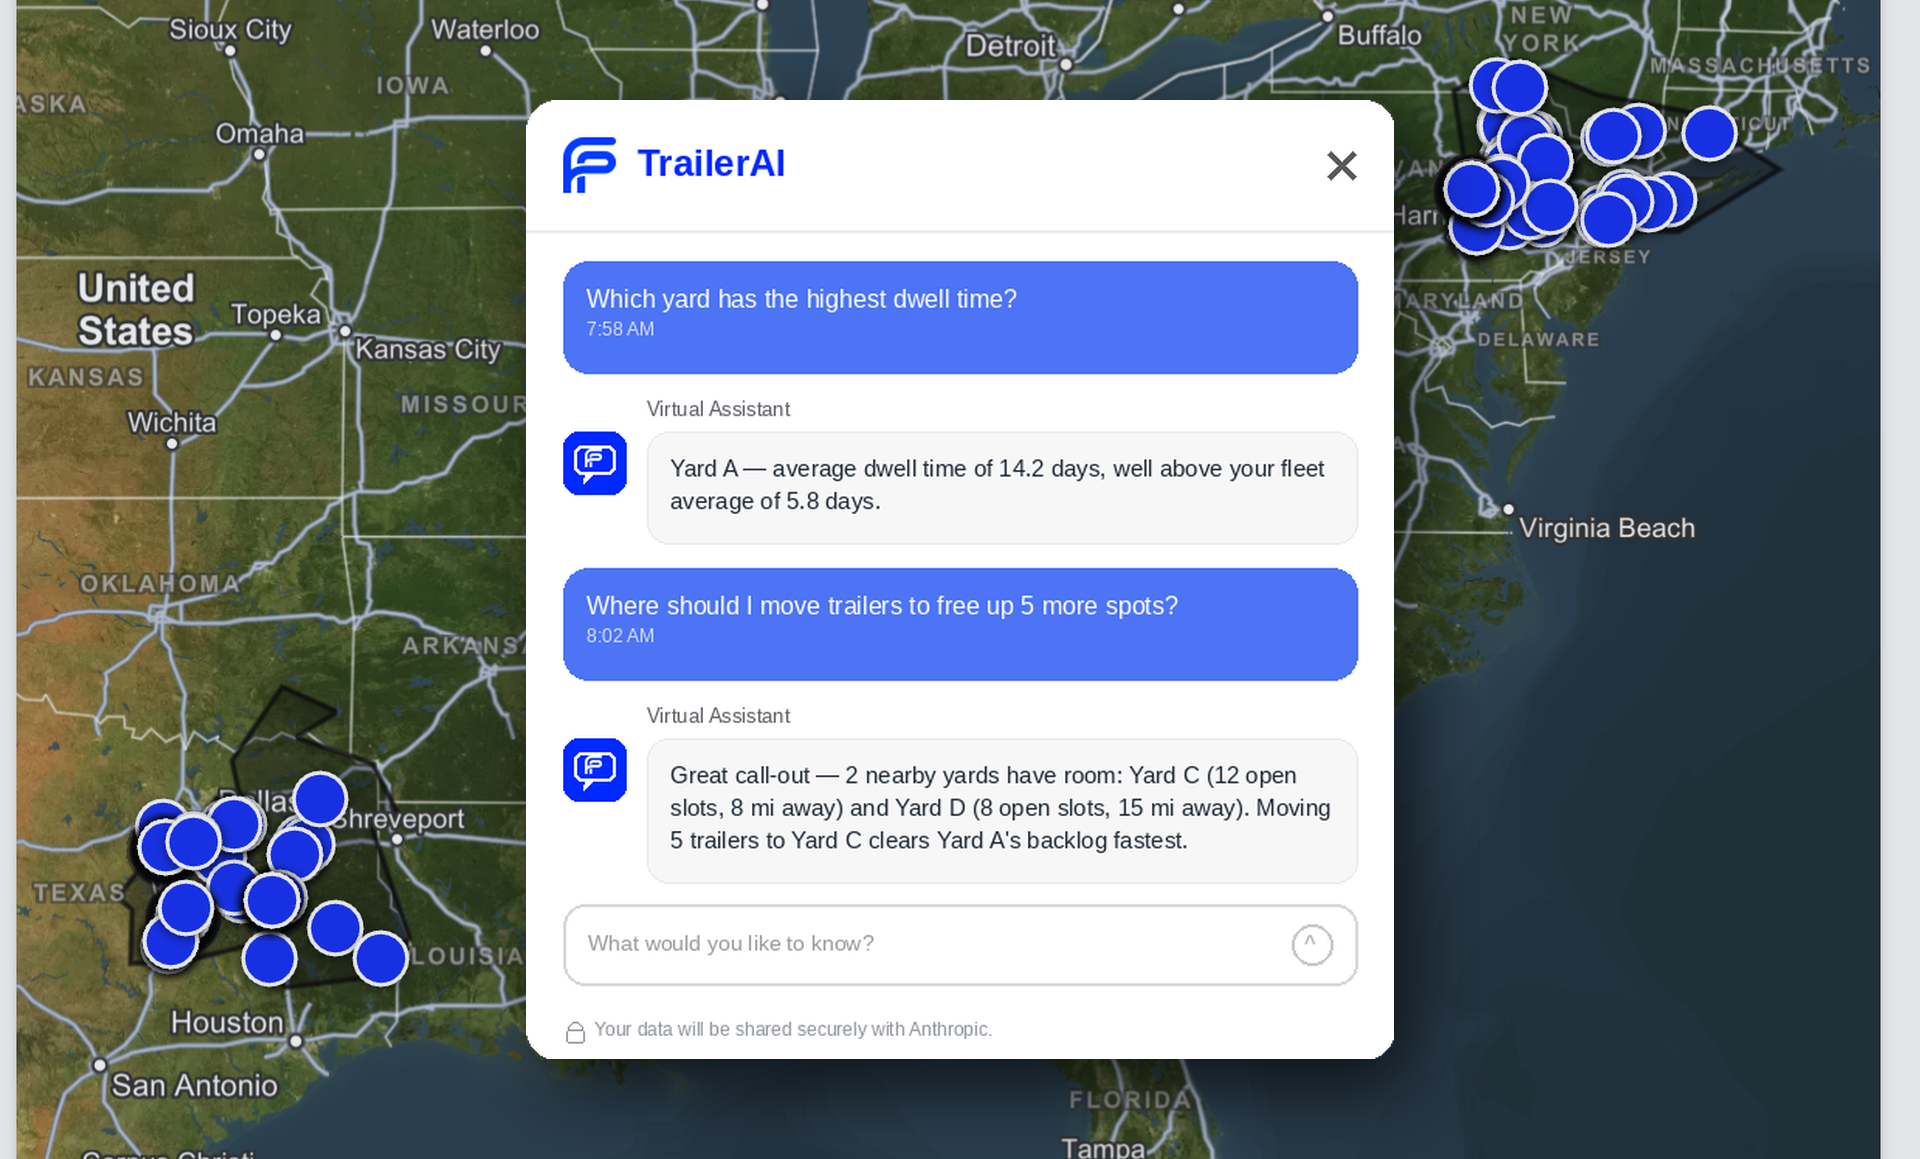
FleetPulse: Trailer AI chat screenshot
A map of the central and eastern United States with clusters of blue location markers in Texas and New York areas. Overlaid is a chat interface from TrailerAI virtual assistant showing a conversation about trailer yard management: Yard A has an average dwell time of 14.2 days, above the fleet average of 5.8. The assistant suggests moving 5 trailers to Yard C to clear Yard A's backlog, noting Yard C and Yard D have open spots. A text input field is below the chat messages.
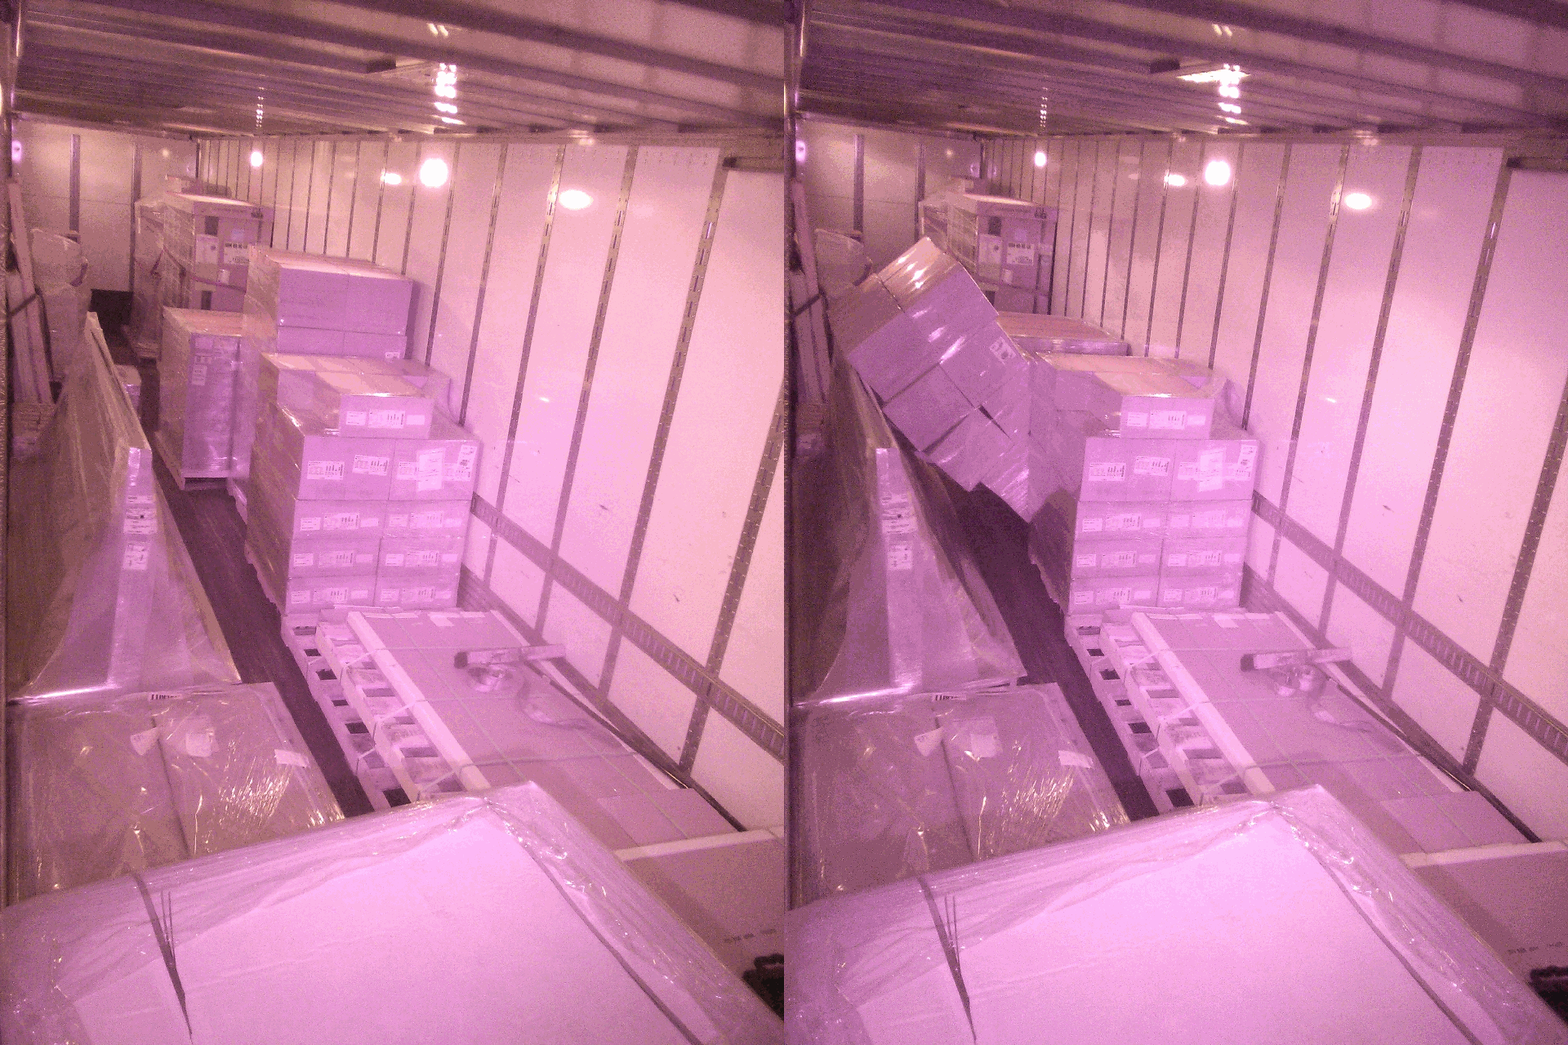
FleetPulse: Cargo AI cargo shift animation

Cargo Protection

Settle cargo claims with evidence.

Every door event captures a photo of what's inside - so you're never guessing what happened between pickup and delivery. Shifted freight or an unscheduled opening automatically triggers an alert, and every image is timestamped, geotagged, and tied to location data. When a claim comes in, you pull one report instead of piecing together a timeline.

Interior of a truck trailer loaded with several stacks of palletized boxes and large flat items wrapped in plastic, arranged along the sides, under overhead lighting.

Activity & Utilization

Rank your trailer fleet by what each trailer is earning.

Dwell per unit, per yard, per customer, and per lane, ranked from worst to best and bucketed by how long it's been sitting. This is the number that tells you which trailers need to move. One trailer fleet used it to release 228 trailers, earning $4.3 million in revenue without losing a dollar.

FleetPulse: Idle Asset dashboard
Dashboard showing idle asset cost and dwell time data for trailers: $158K tied up in 43 trailers idle 60+ days, $946 per day burn, 7,182 idle days, $22 industry avg per day, 7.0% fleet idle. Dwell time donut chart shows 16.2 days average with distribution: 7.0% idle 60+ days, 4.1% 30-60 days, 4.7% 14-30 days, 5.6% 7-14 days, 78.6% 0-7 days. 19% increase in dwell time vs last month. Filter data options by trailers, dwell time, group, geofence with trailer list including IDs, locations, groups, last moved dates, and dwell times.
FleetPulse: Yard check screen shot - dashboard and geofence

Yard Check

Replace the yard walk.

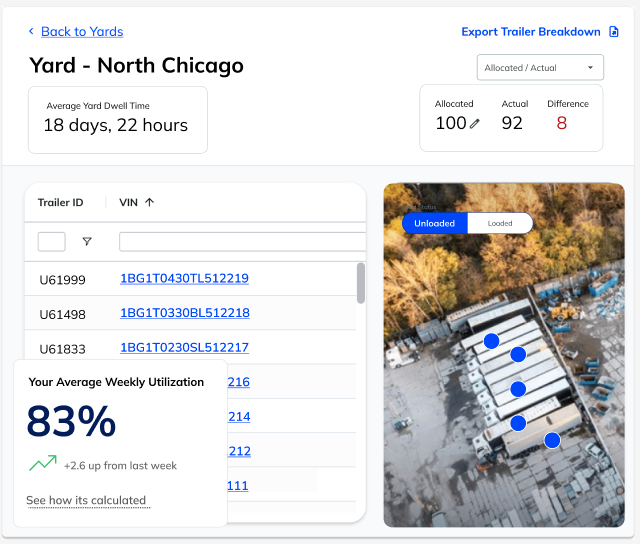
See every trailer in the yard, sorted by how long it's been sitting — so aging trailers and detention risk surface before they cost you. A live view of actual vs. allocated trailers shows exactly where your pools are out of balance, across every yard you run, at the same time.
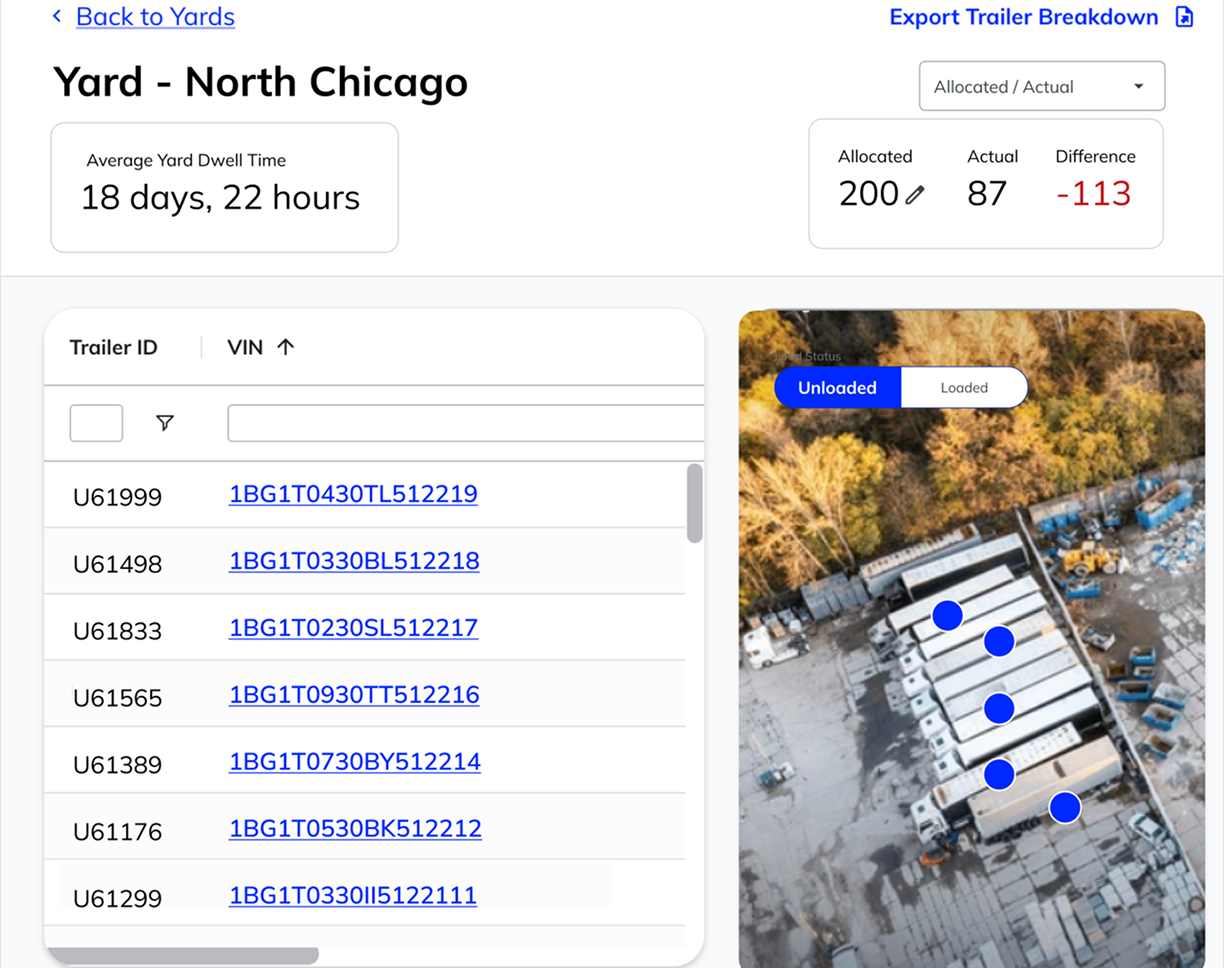
Dashboard screen showing yard management for 'Yard - North Chicago' with an average yard dwell time of 18 days, 22 hours. It displays allocated trailers at 200, actual trailers at 87, and a difference of -113 in red. A table lists trailer IDs and VINs sorted by VIN, with seven trailer entries visible. An aerial view image of a yard on the right shows several trailers parked in a row with blue markers and a toggle for load status set to 'Unloaded'.

Trailer Health

Faults sent as work orders.

ABS faults, tire pressure, wheel-end temperature, and light data stream off the trailer. FleetPulse turns them into prioritized work orders, so the shop completes the repair instead of dispatching road service — and a lamp outage gets caught before it becomes a violation or safety issue.
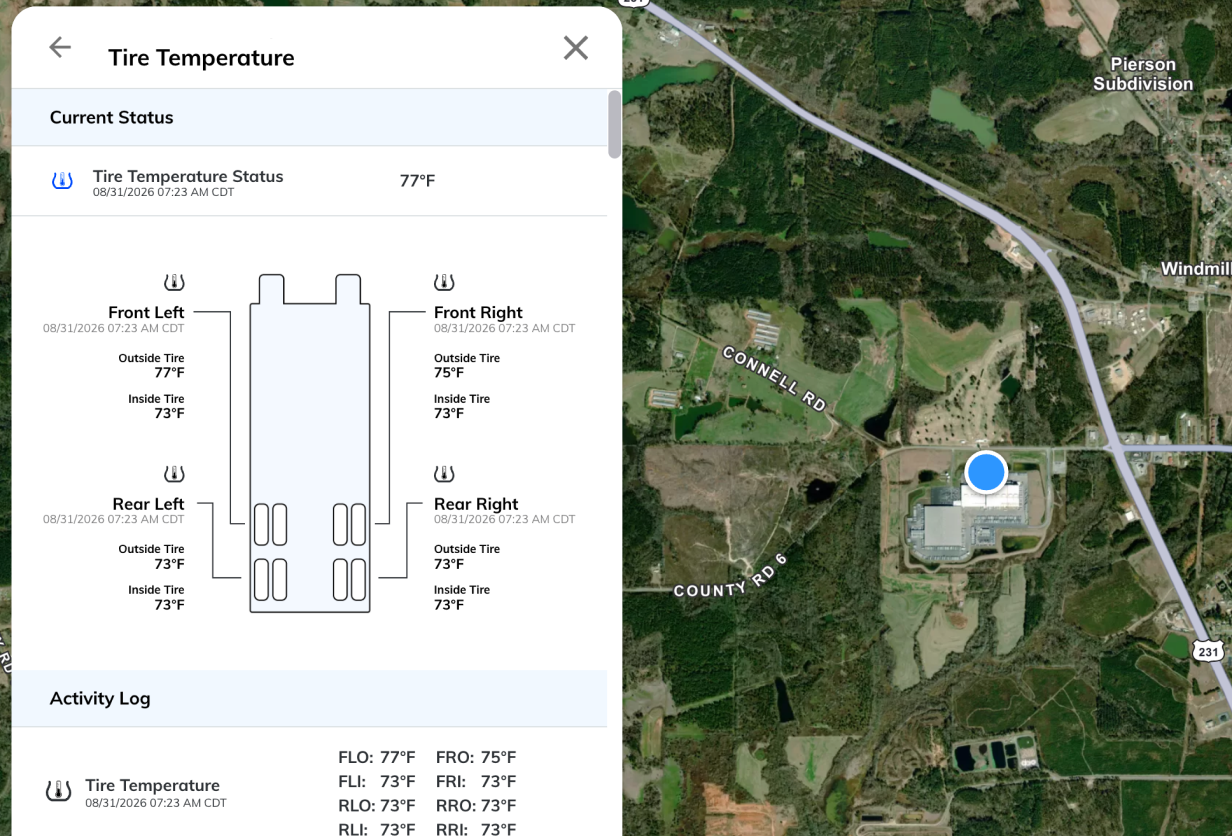
FleetPulse: Tire inflation system view of the trailer in FleetPulse dashboard
Smartphone screen showing tire temperature status for a vehicle with temperatures for each tire: front left outside tire 77°F, inside 73°F; front right outside 75°F, inside 73°F; rear left outside 73°F, inside 73°F; rear right outside 73°F, inside 73°F, all recorded at 08/31/2026 07:23 AM CDT. On the right, a satellite map shows a building near Connell Rd and County Rd 6 with a blue location dot.

capabilities

The questions your team asks every day.

One record for every trailer, one login, whatever hardware is bolted to the frame.

Location & Movement
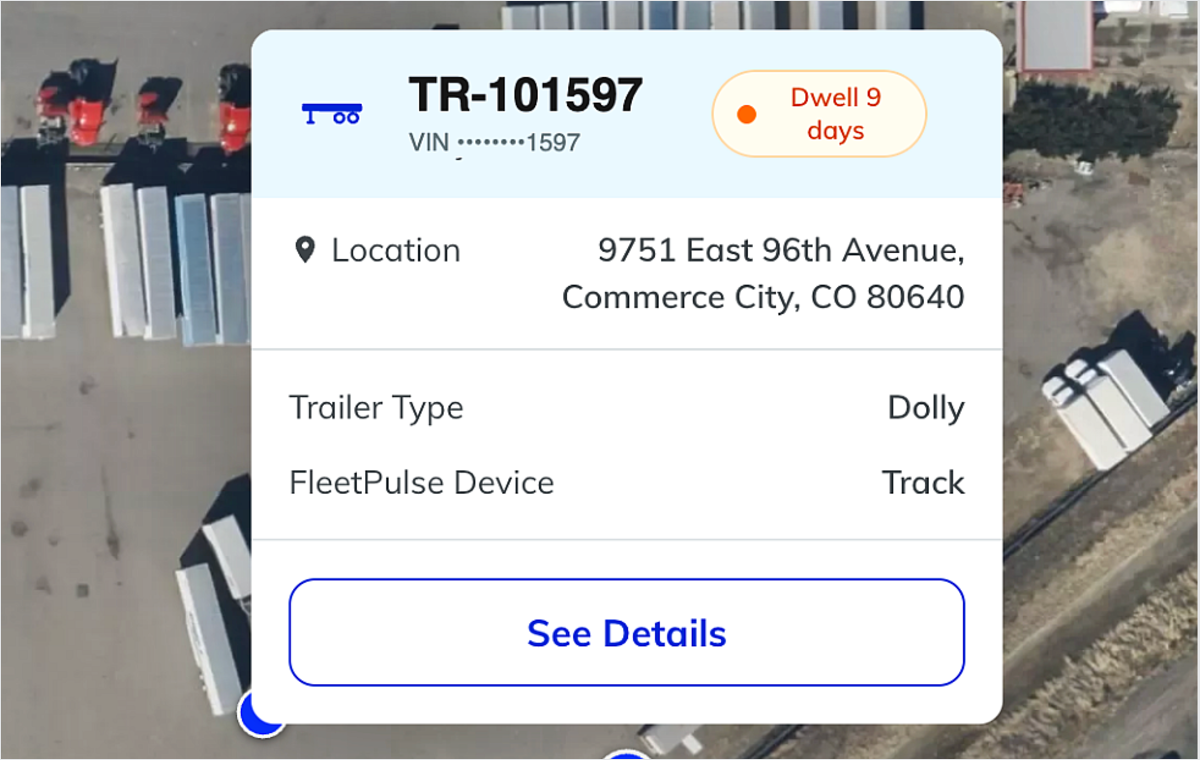
Trailer drawer with dwell details

Where is the trailer I need to move?

GPS, geofenced yards, and a movement history your team can count on without a phone call.

Activity & Utilization
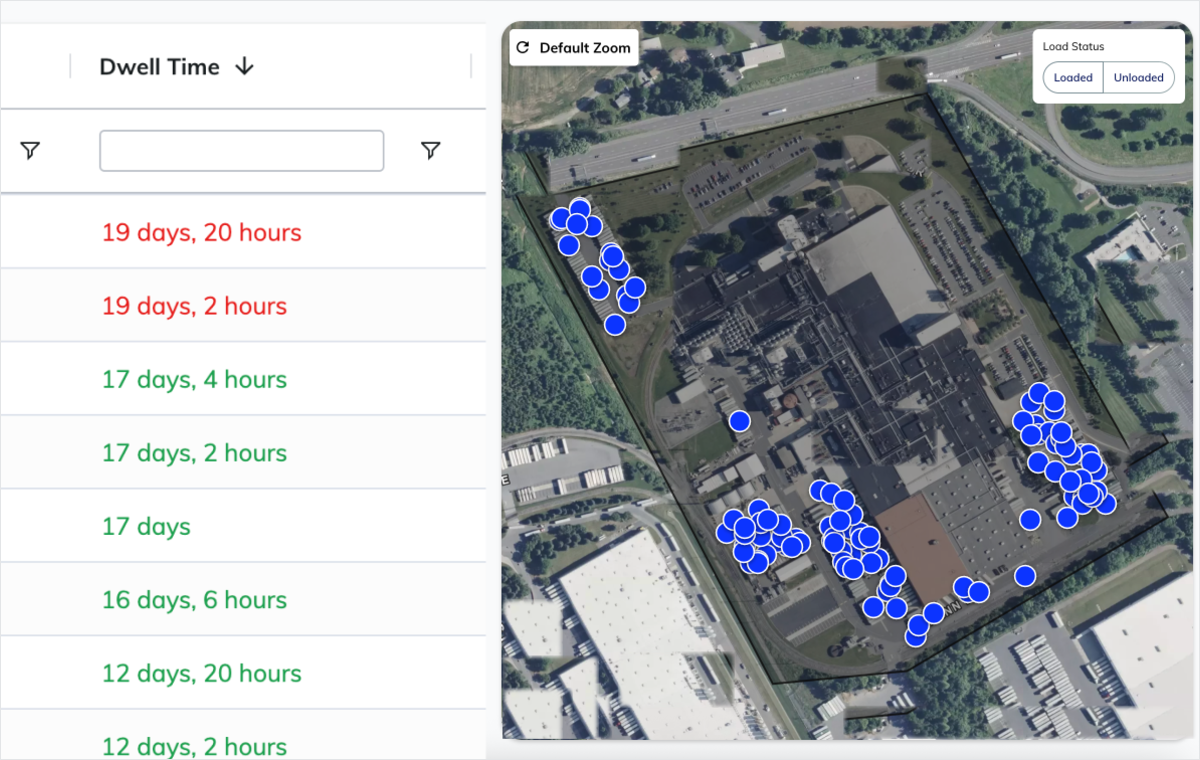
FleetPulse Yard check utilization

Which trailers are and aren't earning?

Dwell per yard, per unit, per customer, ranked from worst to best.

CargoView
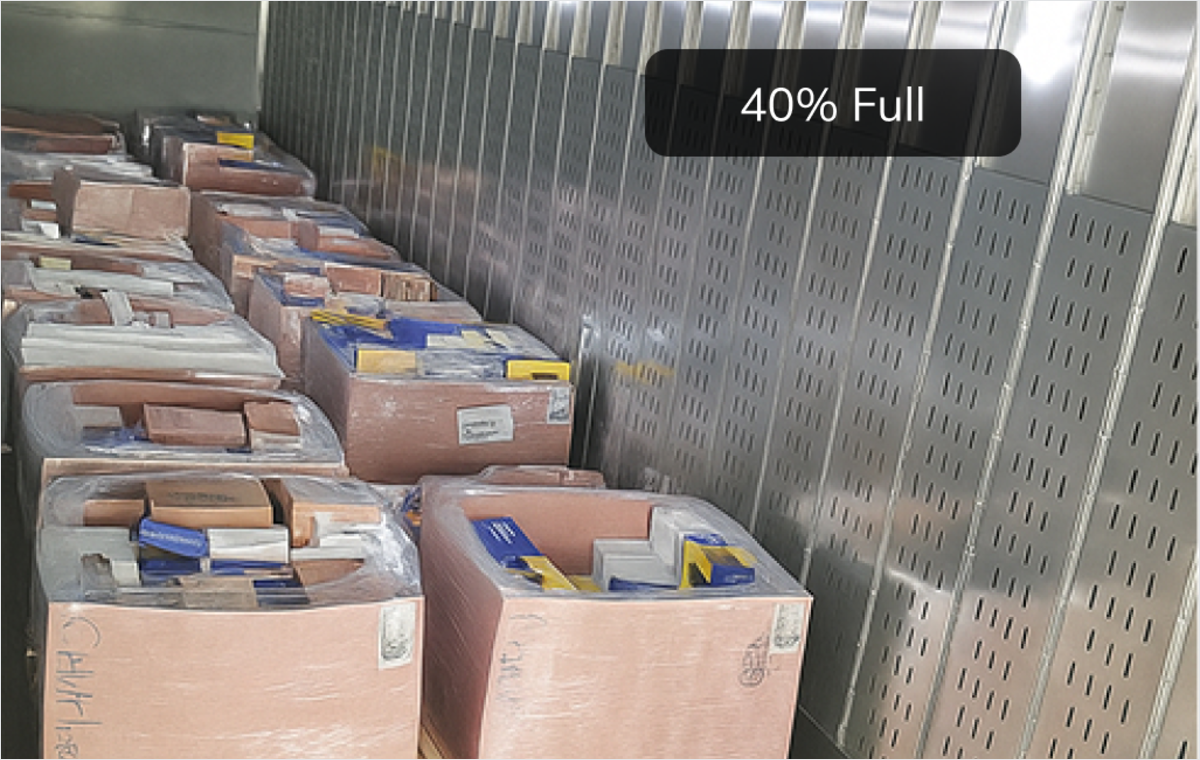
FleetPulse CargoView cargo hold image

What is the loaded status of my trailer?

In-trailer images capture the load state at every door event and flag shifted or short freight.

Trailer Health
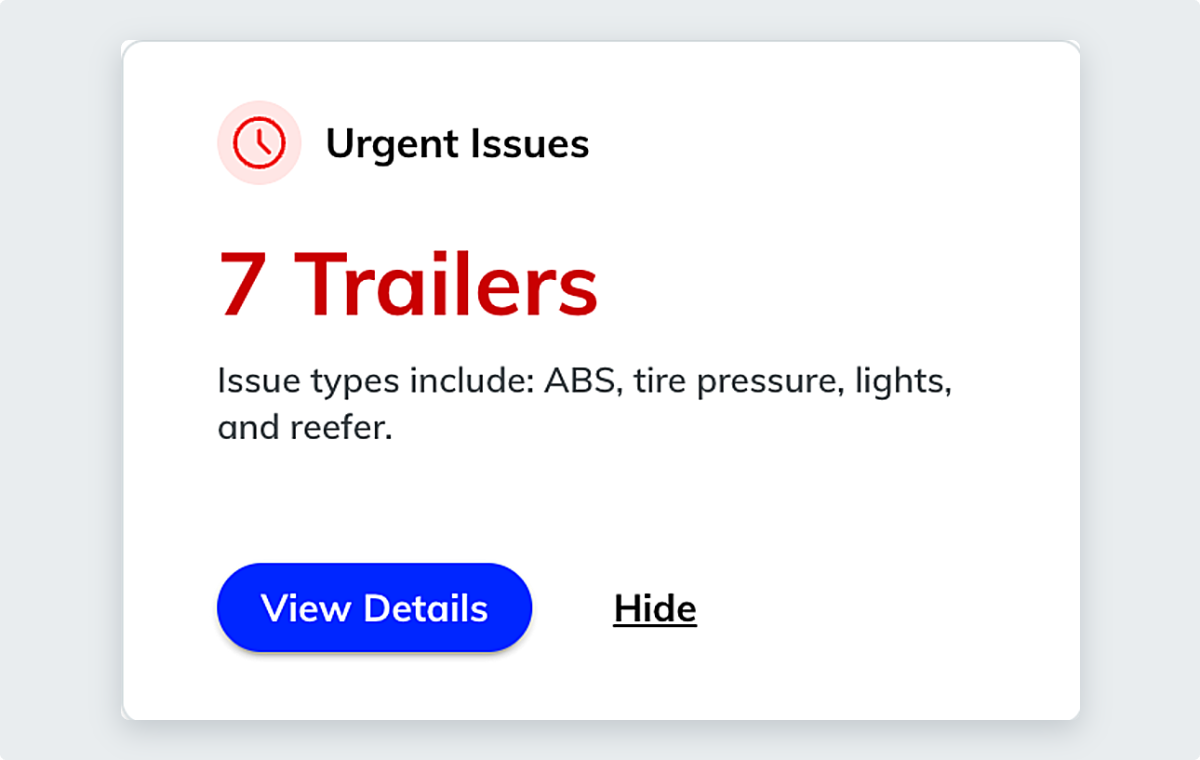
Card titled Urgent Issues showing 7 Trailers with issues like ABS, tire pressure, lights, and reefer, with buttons View Details and Hide.

Which trailers have maintenance risk? 

ABS faults, tire pressure, wheel-end temperature, and lights are flagged as work orders.

Location & Movement
Map interface showing trailer information for TR-101597 with VIN ending in 1597, located at 9751 East 96th Avenue, Commerce City, CO 80640, labeled as Dolly trailer type with FleetPulse device tracking and a dwell time of 9 days. Blue location markers are on the aerial map view of trucks and trailers at a lot.

Where is the trailer I need to move? 

GPS, geofenced yards, and a movement history your team can count on without a phone call.

Activity & Utilization
Dashboard showing a list of dwell times in days and hours on the left with red and green text, and a satellite map view of a factory complex on the right marked with clusters of blue location pins indicating specific points within the facility. Controls for default zoom and load status toggle between loaded and unloaded are visible on the map.

Which trailers are and aren't earning?

Dwell per yard, per unit, per customer, ranked from worst to best.

CargoView
Inside a storage container with metal walls, large pallet-sized boxes wrapped in plastic and filled with various smaller cardboard boxes and items, labeled as 40% full.

What is the loaded status of my trailer?

In-trailer images capture the load state at every door event and flag shifted or short freight.

Trailer Health
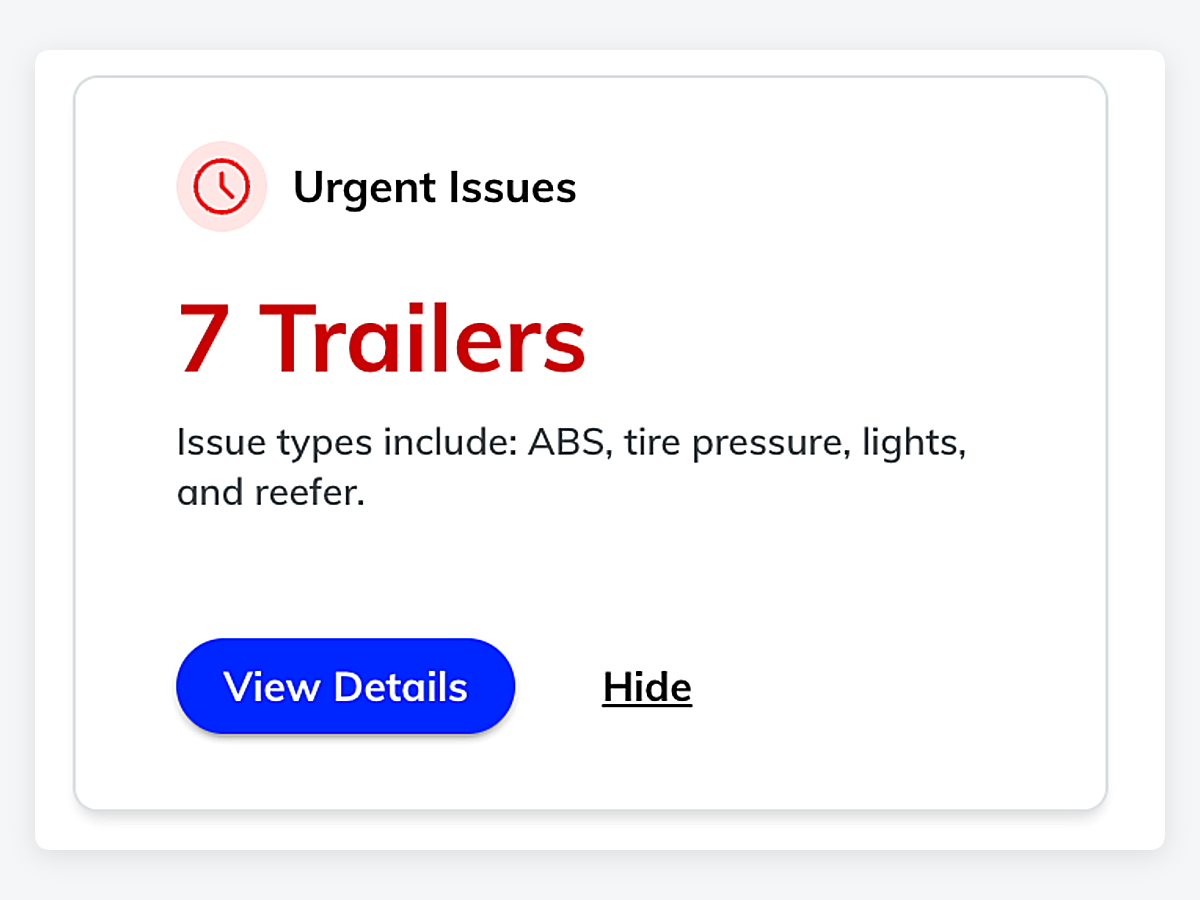
Card labeled Urgent Issues with a red clock icon, showing 7 trailers have problems including ABS, tire pressure, lights, and reefer, with blue View Details button and a Hide link.

Which trailers have maintenance risk? 

ABS faults, tire pressure, wheel-end temperature, and lights  are flagged as work orders.

Customer Voices

What our customers say

"FleetPulse is the source of truth. I log in every day before 8 A.M."

Anthony

COO - Sibley Transportation
"We had a paradigm shift in the company. We're totally rethinking how equipment is managed thanks to FleetPulse."

James

Head of Fleet, Standard Logistics